IW PROCESS SOLUTIONS
  • Home
  • About
  • Services
    • Consultancy
    • Training
    • Mentoring
  • Case Studies
  • Testimonials
  • Contact
New Balance
Athletic Shoe Manufacturing
Picture
To assess the current process and apply appropriate Lean Manufacturing tools and techniques to enable more efficient manufacturing on their athletic shoe assembly line.
Project Description:
Current State:​
The company made two types of product; Sourced and Cut to Box.
Sourced
Completed uppers for the shoes were bought in from the Far East.  A collation stage within the factory boxed these uppers with corresponding soles and packaging in set quantities (lines).  A pallet would be loaded with these boxes and fed into the assembly area where a number of manufacturing cells would debox the product and assemble the uppers to the soles.  The cells were manned with five operatives who carried out the assembly process.  Work-in-progress existed between each process stage within the cell and some operations were more complex than others.

Cut to Box
For this product, components were cut from the raw material and sewn together to form the upper.  Some of the stitching processes were automatic and some were manual.  Each stage of the process was grouped in a different part of the factory and work-in-progress moved from one process stage to the next when completed in baskets.  Once the upper was complete, it would then be fed into one of the manufacturing cells where it would be paired with the corresponding soles and assembled.
 
Future State:-
Sourced
The manufacturing cells were re-designed to have only four operatives assembling the product, each with a carefully defined amount of work such that all four processes took the same amount of time.  Work-in-progress within the cell was eliminated by implementing a single piece flow methodology. The future state manufacturing cell was smaller in footprint than current state and 5S was introduced to demarcate the new layout.  Freed up operatives were grouped into more teams and new cells created in the space freed up from the reduced footprint size of the existing cells.  Systems were put in place to control the amount of work-in-progress fed into the factory which freed up even more space for further manufacturing cells.

Direct Benefits Achieved:
  • 35% Productivity improvement
  • 35% reduction in Manufacturing Cell footprint
  • Factory capacity tripled from 1 million pairs per year to 3 million
  • Cost competitive with Far East on outsourced manufacturing of the sourced product

Cut to Box
A large manufacturing cell, renamed as a Value Stream, with enough equipment from every process stage of sufficient quantity required in order to manufacture an upper from start to finish was created.  The equipment was laid out to facilitate single piece flow and manned accordingly.

Direct Benefits Achieved:
  • Lead time for manufacture of product reduced from 10 weeks to one hour
Other Benefits:
  • Finished Goods stock reduction
  • Stock accuracy up from 64% to 90%+
Picture
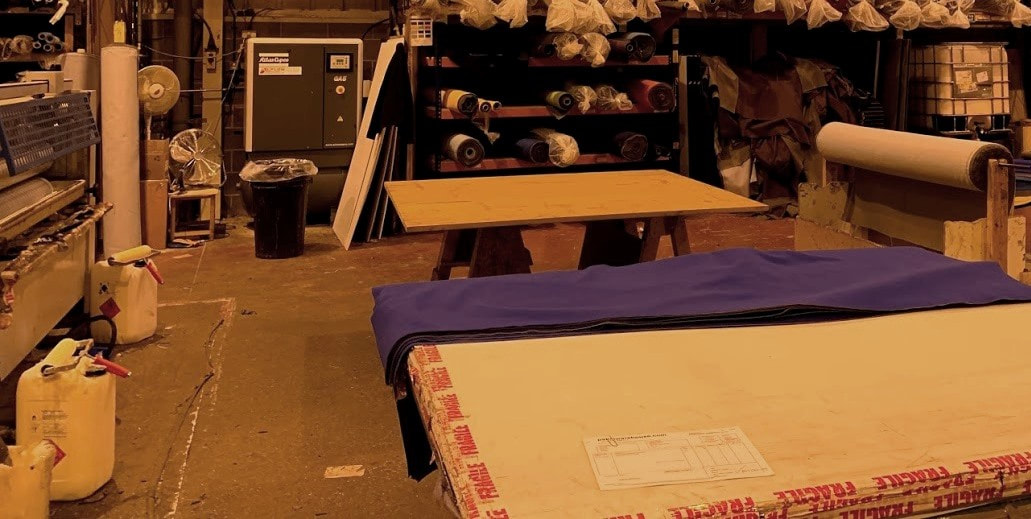
This photograph shows the factory floor before the introduction of Lean Manufacturing. The processes are arranged in process silos and the majority of the available floor space is filled with work-in-progress between the silos. Analysis showed that only 40% of the available floor space contained value adding activity.
Picture
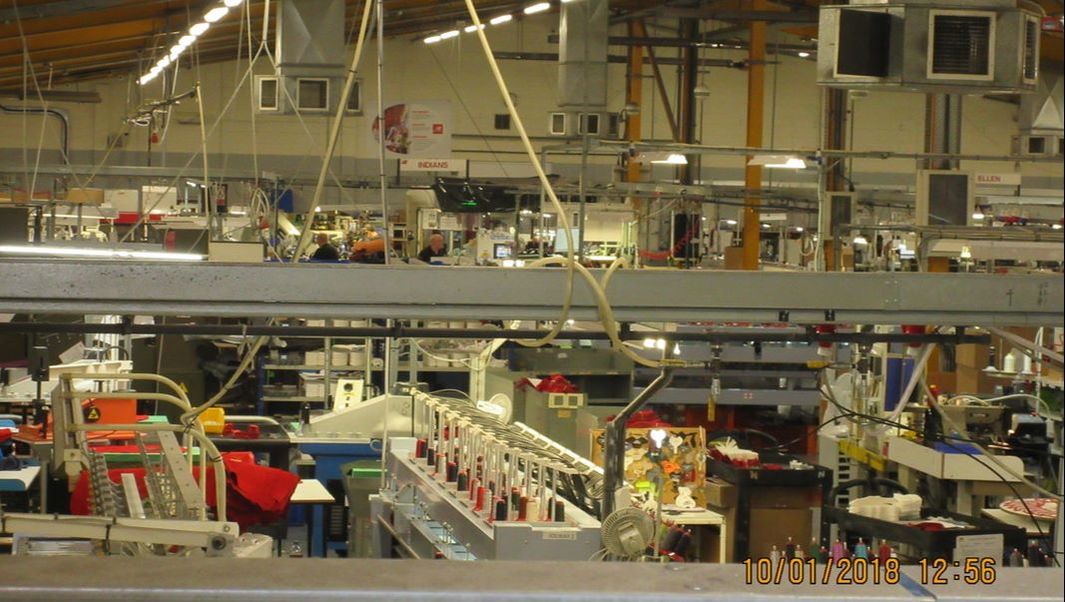
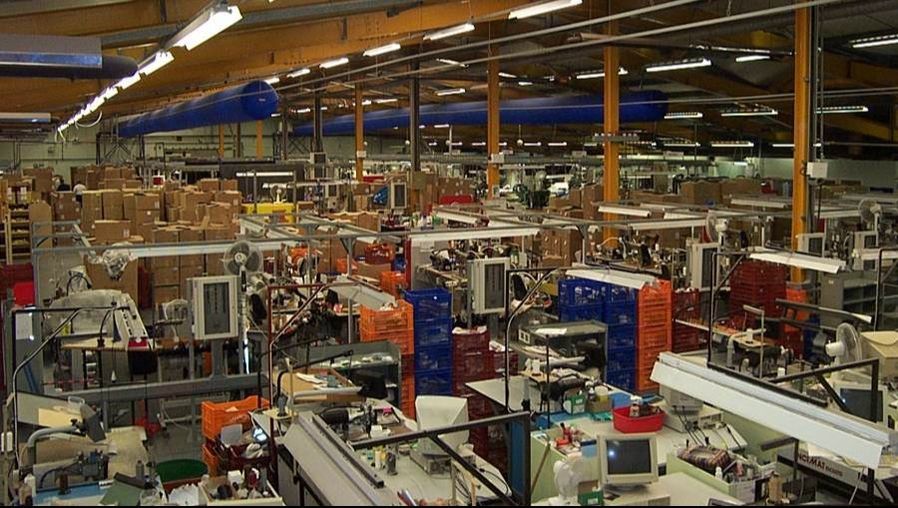
This photograph shows the current shop floor with minimal work-in-progress and floor space utilisation above 90%.
Picture
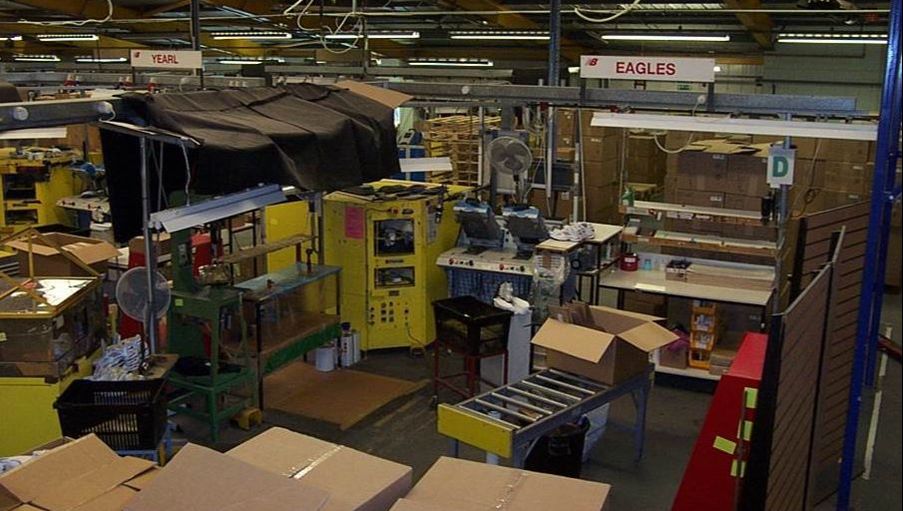
This photograph shows one of the manufacturing cells before the introduction of Lean Manufacturing.
Picture
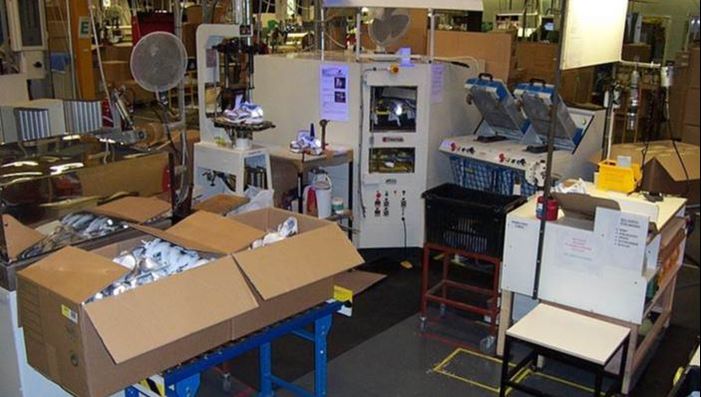
This photograph shows the manufacturing cell after the team had redesigned it using Lean principles. The cell was 35% smaller than the previous cell and only required four operatives compared with five before the change, achieving the same output. This equated to a 35% Productivity improvement.
Picture
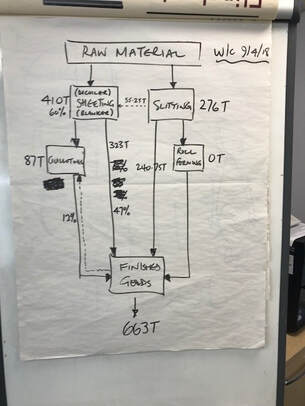
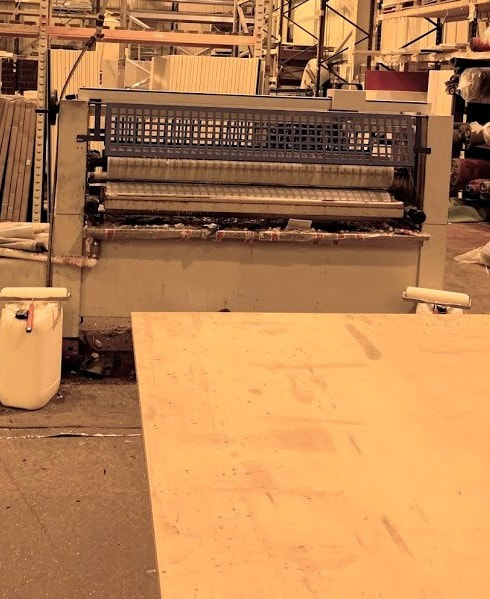
This photograph shows the development of the first value stream for the Cut to Box product, where the requisite number of machines from each process stage were joined together in one large cell. Once implemented, the value stream reduced the manufacturing lead time from 10 weeks to one hour.
Picture
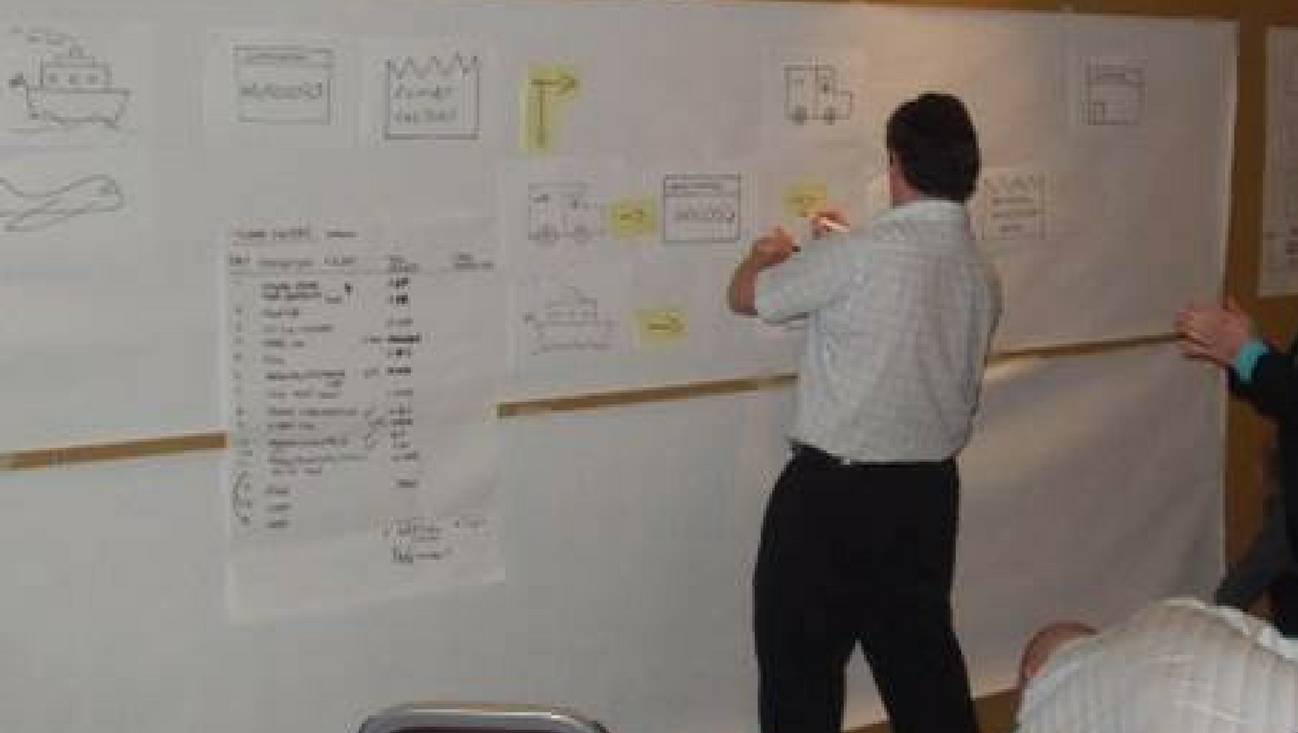
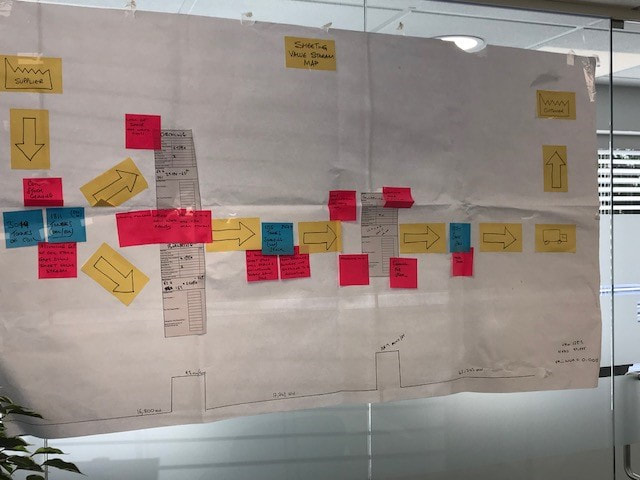
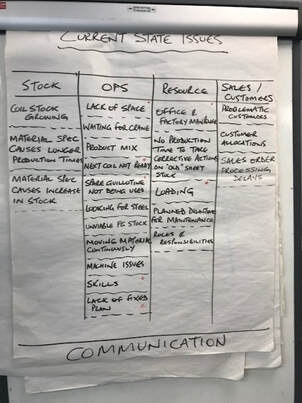
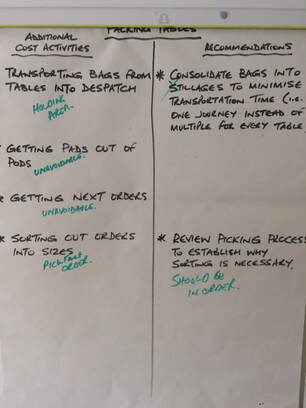
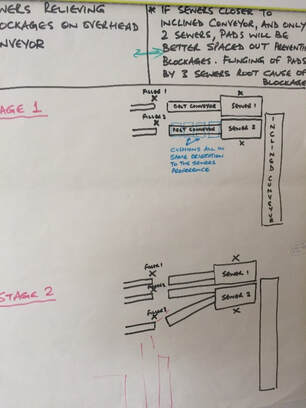
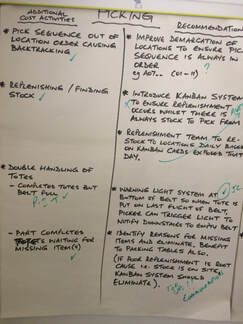
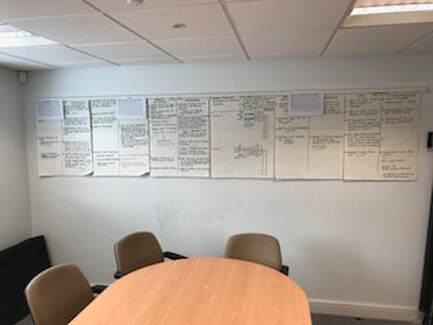
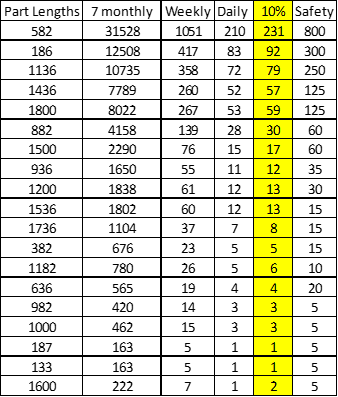
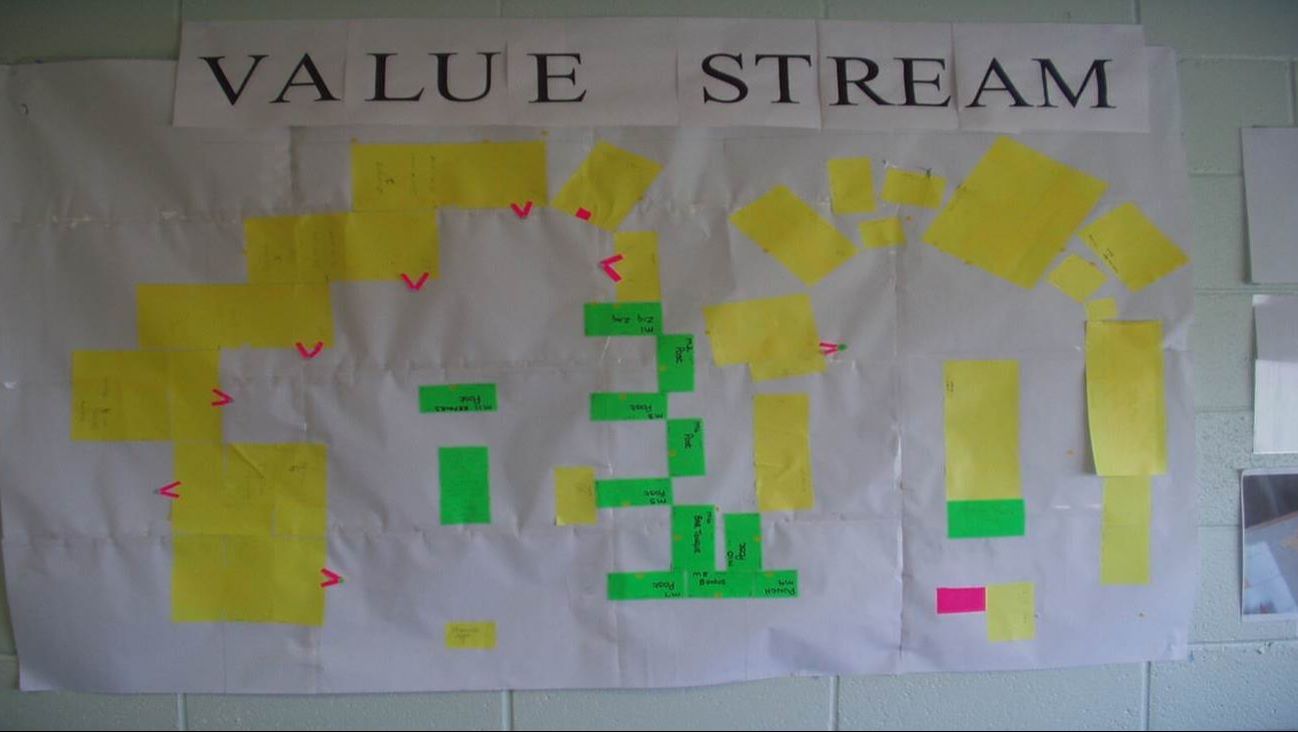
This photograph shows a value stream mapping exercise in progress with members of the New Balance team developing a current state map of their business. They went on to create a future state map which delivered a significant reduction in the levels of finished stock and a system that improved their stock accuracy by over 25%.

"Ian has become a trusted and valued member of our team who just doesn't work here all of the time."

ANDY OKOLOWICZ - FACTORY MANAGER AT NEW BALANCE 

Esse Engineering
Stove Manufacturing
Picture
To assess the current process and apply appropriate Lean Manufacturing tools and techniques to enable more efficient manufacturing on their stove assembly line.
Project Description:
All stove products were manufactured on an assembly line which had a team of five assembly operatives permanently assigned to it.  Outputs were variable and a working structure existed in which some assembly operatives had free time in between products, depending upon the product mix.
 
An initial data analysis exercise concluded that, on average for most of the year, the company was selling around 120 stoves per week.  From this information, a takt time was determined which would act as the drumbeat for output from the assembly line.  The data analysis also found that the product range could be grouped into four categories, based on assembly times, and that 80% of Sales were of the category containing the lowest assembly time products.
 
The weekly plan was re-organised such that the products were manufactured in category order from the easiest to the most complex.  Further analysis of the work content involved in the easiest categories indicated that two assemblers with an equal amount of work should be able to produce a product to match the takt time previously calculated.  An additional assembler was added later in the week for the penultimate category and a fourth added for the most complex products at the end of the week.  All sub-assembly work was moved off-line and matched to the takt time.  Thus, for 80% of products sold, only three people (two assemblers and one sub-assembler) were required instead of the five previously used for all products.  The layout of the assembly line was altered accordingly reducing the footprint of the line significantly.
 
A performance monitoring system was introduced so that output could be monitored hourly to ensure the takt time was being adhered to and a structured workplace management system defined hourly tasks for the area Supervisor to ensure that all aspects of the operation were where they needed to be, including pre-planning activities for the following week’s production.

"Ian's first visit to our factory was a catalyst for change. He is insightful to an almost embarrassing degree. Intelligent, good humoured but resolute, which means that action has to be taken when he casts his eye over a facility.

I cannot recommend him highly enough!"

MARTIN ASHBY - MANAGING DIRECTOR AT ESSE ENGINEERING 

Optimum Coatings
Lens Manufacture and Coating
Picture
To assess the current process and apply appropriate Lean Manufacturing tools and techniques to achieve a more efficient manufacturing operation.
Project Description:
MD of Optimum Coatings, Paul Bailey, was concerned that potential new business could not be considered as the Production department were struggling to meet current volumes.
 
Analysis of the current state, primarily through observation and process timings, led to the conclusion that capacity was being lost due to product not being ready at the right times to be loaded into their two coating machines.  A more structured work method was devised which would ensure that capacity of these two machines would be maximised, thus creating 25% additional capacity with the same headcount.  The method was future-proofed to ensure it was viable and also that downstream processes could cope with the increased volumes which could be produced with the extra capacity.
 
Additionally, some of the process steps were re-designed to eliminate double and triple handling and a Performance Management system developed based on schedule adherence.  A structured workplace management system was introduced for the process team leaders to ensure that ongoing checks were being made during the 24 hour operation which would guarantee the process was where it needed to be.

"I'd like to thank Ian for the direction he has helped steer us in. As a result of our recent project, we now have a clearer understanding of our true production capacity. 

I would welcome the opportunity to work with Ian again in the future and have no hesitation in recommending him to any organisation looking to improve and understand their process flow."

MARTIN HARWOOD - TECHNICAL & OPERATIONS DIRECTOR AT OPTIMUM COATINGS

Fairham Mouldings
Rubber Mouldings
Picture
To provide training/support to core staff in Lean Manufacturing tools and techniques to enable the business to achieve Fit For Nuclear (F4N) status.
Project Description:
A series of tailored workshops were delivered so that key Fairham staff were trained in basic Lean principles and 5S Workplace Organisation.  The workshops included a practical implementation of the 5S methodology, in different areas of the factory, such that those areas could act as exemplars for a planned roll-out of 5S throughout the entire factory in the near future. 
 
Additionally, the company needed to put together a series of Key Performance Indicators (KPI’s) to monitor how the business was performing in a number of areas to illustrate the benefits achieved during completion of the programme and for future continuous improvement activities.
 
The most valuable resource within any business is their people and when you allow those people to implement their ideas in a structured way, the results can be amazing.

"Throughout the project, Ian's experience and professionalism were of great benefit and he was completely flexible in his approach, always showing great respect for our business needs. 

Due to his support, we have achieved F4N status and we would strongly recommend him to other companies."

DAMIAN WILD - MANAGING DIRECTOR AT FAIRHAM MOULDINGS

Hi-Tech Steel Services
Metal Processing
Picture
To assess the current process and apply appropriate Lean Manufacturing tools, techniques and performance measurement systems to achieve an efficiency improvement within the manufacturing processes.
Project Description:
Hi-Tech Steel Services had an ambitious 2-year Sales growth plan which would increase volumes of steel products produced at the factory by approximately 60%. Managing Director, Ian Gorman, was unsure as to whether the factory had the capacity to cope with the extra tonnage and appointed IW Process Solutions to work with his management team to identify potential barriers.
 
Given that the factory was crammed with Inventory in its many forms, the first step was to create a Value Stream Map to help identify the levels of Inventory and the root causes as to why the Inventory existed.  This led to grouping of the issues into four categories.  From this, individual projects were set by the Managing Director for the management team, each of which would impact upon the amount of Inventory.
 
The next step was to understand the Utilisation performance of the three key machines within the business as this was where additional capacity would be required to support the volume increase.  A data collection system was developed to collect information as to the losses on the machines.  Further projects were identified as a result of this data to reduce the highest contributing loss on each machine.
 
Additionally, a review was carried out of all orders/customers to identify problematic orders.  For example, a number of customers ordered product of a material which caused the machine to run at around 35% of normal speed.  Going forward, any orders sanctioned of this material were immediately sub-contracted out to protect the in-house capacity.
 
Finally, the focus shifted to labour utilisation, particularly in the Shearing department where manning levels were high.  Several ideas were recommended which could potentially reduce manning levels significantly, thus further reducing Hi-Tech’s manufacturing costs.

Picture
This picture depicts the tonnages processed down the primary process routes with the Hi-Tech business.
Picture
This picture shows Value Stream map created by the management team for one of the primary process routes.
Picture
This picture shows the issues arising from the Value Stream Map, grouped into the four categories.
Picture
This picture shows the data collection system developed to collect information as to the losses on the machines.
Picture
This picture shows the Utilisation performance chart for one of the primary process routes.
Picture
The management team used the data collected to produce this Pareto chart highlighting the nature of the losses on this machine.  This fed into the project identification for the management team to improve Utilisation.

"We had been wrestling with problems related to workflow in our 47,000 sq.ft. factory for some time. Then Ian came along and with his structured approach he introduced us to Value Stream Mapping. The results have been remarkable in both understanding and tackling the problems via the pictorial evidence. Our team is now fully motivated and savings are starting to accrue."

STEVE WELLS - CORPORATE DEVELOPMENT MANAGER AT HI-TECH STEEL SERVICES

Cleland McIver
Household Textiles
Picture
To assess the current process and apply appropriate Lean Manufacturing tools and techniques to achieve a more efficient manufacturing operation.
Project Description:
Phase 1
For Operations Director, Paul Adams, something wasn’t quite right regarding his manufacturing costs.  To provide the detailed information he required to confirm his suspicions, IW Process Solutions was commissioned to collect process data from all areas of the business as a Time & Motion study.

As well as collecting data, from observing the processes within the factory, IWPS were able to put forward a number of improvement recommendations to increase Productivity and reduce manufacturing costs even further.  These were presented back to Cleland as a series of flip chart pages/email summaries which steadily grew as the project continued.
 
From the data collected, a final Target matrix was developed by IWPS which set the output targets achievable for all areas depending on the labour resource available and the configuration employed.  Short Interval Control boards were introduced into several areas of the factory to drive performance in real time with significant impact.

These pictures show notations on flip chart paper of opportunities for improvement identified following analysis of the current process:
​
Picture
Picture
Picture
Picture
Picture
Phase 2
Towards the end of Phase 1, a restructuring of the Production Management team took place.  A new Production Manager was identified but Paul Adams recognised that he required some further support if the opportunities from Phase 1 were to be fully delivered.  IW Process Solutions were commissioned to mentor the new Manager through his initial 6 month period in the role to equip him with the necessary skills and knowledge to deliver the improvements.  At the end of the 6 month period, significant improvement had been made in the majority of areas with all key metrics being on or above target.

"It was apparent something wasn't right, we could see that efficiencies' had been reducing.  I contacted Ian to discuss his thoughts; to get an opinion from someone outside the business.
From the first meeting Ian's knowledge and insight was obvious; sometimes you just need to see it from another perspective.  A vastly experienced consultant, whom is extremely personable which helps when you are trying to implement changes!!  Ian had the team buying in to collective ideas results speak for themselves.

We have only looked at part of the business and already have plans to see how we can improve others. An insightful and very successful project - I would 100% recommend IWPS.  Thanks Ian
."

PAUL ADAMS - OPERATIONS DIRECTOR AT CLELAND McIVER

Pinewood Associates
Office Screen Manufacturer
Picture
To assist the Company in improving operational efficiencies to support increasing Sales through application of the appropriate Lean Manufacturing tools and techniques.
Background:
Pinewood Associates Ltd have been successfully manufacturing quality Display Boards and Office Screens for reseller clients within the Education Supplies, Office Furniture, Stationery and Exhibition Industry for over 20 years.  Increasing demand for its products had created a number of problems for the Management team and they approached IW Process Solutions to identify possible changes to increase productivity in line with the rising number of orders.  
​
Project Objective:
To assess the current manufacturing processes and introduce changes to increase productivity and eliminate waste through the application of Lean Manufacturing Tools and Techniques.  

Project Delivery:
The project was delivered in a number of phases which were prioritised by the Pinewood team, in relation to the differing levels of increased demand being experienced by the various manufacturing sections within the factory.  A number of Lean Manufacturing techniques were to be used across the factory to create the Future State layout needed to improve efficiencies:
  • Cellular Manufacturing
  • Line Balancing/Single Piece Flow Implementation
  • Visual Process Management
  • Kanban Stock Control Procedures
  • Demand Levelling
  • 5S Workplace Organisation
Current State:
The product experiencing the highest level of increased demand was Office Screens.  This was a multi-stage process which had stations spread across the shop floor and a batch system was employed at each stage.  Assembly personnel would move about from stage to stage as and when batches were completed at a stage.  At the end of each day, production would stop to facilitate the packing of all the product produced that day ready for collection by courier.

There were two other primary manufacturing centres, one which focused on Aluminium framed product and another which produced PVC framed product.  


Each manufacturing centre was supplied with wood, aluminium and PVC parts in various standard lengths from a Cutting area at one end of the factory.  This area was continually under pressure with demand for parts coming from multiple centres at the same time.  Occasionally, this led to production in one or more centres stopping waiting for parts to be cut.  It had also forced the business to consider recruiting additional resource for this area.

At the other end of the factory was a Packing centre which packaged the Aluminium and PVC products manufactured each day.

Three sides of the factory were racked out to hold stocks of packaging, covering materials (rolls), accessories etc etc.
This photograph shows the adhesive application machine used in the process of manufacturing office screens.  Some of the completed frames waiting to be processed can be seen stored in the racking behind the machine.​
Picture
This photograph shows the Material Covering table following the application of the adhesive.  The roll of material can be seen at the head of the table waiting to be rolled out over the frame.
Picture
Future State:
Office Screens:
The team were trained in the principles of Lean Manufacturing, focusing on line balancing and single piece flow, and then tasked with considering what changes they could make to their process based on what they'd learnt.  Immediately they could see the relevance and a three stage process was developed, with two people permanently assigned to each stage (a saving of one person from the Current State).  The work content was divided up so that each stage took approximately the same time so that single piece flow could be introduced.  Additionally, the work content of stage 3 included the packaging of the product, thus extending the amount of time each day that could be spent producing.  By the end of the training day, the team had marked out on the shop floor where all of the machines, assembly tables and parts were to be located to create a Flow line.
Once the layout changes had been made and the team settled with the new working methods, a Short Interval Control board was introduced to provide a visual display of the teams performance against target on an hour-by-hour basis.
Aluminium & PVC:
The creation of the Office Screens Flow line on one side of the factory then facilitated the moving of the other two manufacturing centres alongside it to create three Value Streams side-by-side.  It also allowed the Packing Centre to be incorporated into the central factory area thus freeing the fourth side of the factory to be racked out for additional storage if required as volumes continued to grow and grow.  Additionally, by moving these two manufacturing centres closer to the Cutting area, it significantly reduced the distance needing to be travelled delivering/collecting parts.  A similar process management system to that employed in Office Screens, the Short Interval Control board, was planned to be introduced into these two centres.
Cutting Area:
To further reduce the pressure upon the Cutting area, a series of kanbans were created between the Cutting area and each Value Stream which would hold approximately 4 hours worth of all the various standard lengths of parts each Value Stream used.  The parts were loaded into the kanbans on the Cutting side and emptied from the Value Stream side further reducing any travelling associated with delivering parts meaning more cutting time for the Cutter.  The empty kanban was easily visible to the Cutter and would signal that this part would need replenishing but it meant that no "immediate" demand would be placed on the Cutting area from any Value Stream allowing the Cutter to plan what he needed to cut and when.  Also, no production stoppages waiting for parts would occur.
Additonally, since Office Screens were the biggest growth area, another technique was used to average out the demand for parts for this Value Stream to control the time spent daily on parts for this Value Stream.  T​he following spreadsheet shows how the seven months of Sales data was analysed and broken down to quantities used on average during a day to attempt to level the demand on the Cutting area for wooden parts:
Picture
Across the size range of Office Screen sold, it was calculated how many pieces of each part length were used in each product and multiplied by the amount of screens sold of that size over the seven months. This then gave the total number of each individual piece length used in all of the screens sold in the period, the column headed "7 monthly". This amount would automatically include the surge in Sales experienced by the business up to that point.  From this total amount, a daily average was calculated and 10% added to allow for further growth in Sales.  The 10% column therefore represents the levelled demand for wooden parts for the Cutting area.  Finally, a "Safety" amount was calculated to cover for daily fluctuations in sizes sold to cover worst case scenario. 

As a result of these changes, the business shelved plans to recruit additional resource for the Cutting Area.
Workplace Organisation:
To raise the standard of tidiness and cleanliness throughout the factory, all staff were trained in the 5S methodology and then given time to apply the methodology to their work areas.

"From the very first moment Ian saw the shop floor, it was obvious that he could see the opportunities for improvement and had a vision as to what our Future State would look like.  The Flow Line Ian introduced with the team continues to deliver increased outputs and Productivity benefits."

LYN BOARDMAN - OPERATIONS DIRECTOR AT PINEWOOD ASSOCIATES

Want to read more?

VIEW ALL CASE STUDIES
Picture
IW PROCESS SOLUTIONS LTD
287 VALLEY DRIVE, KENDAL, CUMBRIA, LA9 7SJ
​
M: 07539535253   |  E: [email protected]
© COPYRIGHT IW PROCESS SOLUTIONS LTD 2017. ALL RIGHTS RESERVED.
IW PROCESS SOLUTIONS LTD IS A LIMITED COMPANY REGISTERED IN ENGLAND AND WALES. REGISTERED OFFICE: 287 VALLEY DRIVE, KENDAL, CUMBRIA, LA9 7SJ. REGISTERED NUMBER: 10104584
  • Home
  • About
  • Services
    • Consultancy
    • Training
    • Mentoring
  • Case Studies
  • Testimonials
  • Contact